To show the Analytical part click “Analytics” in the upper bar. Analytical section offers a clear view of the patient exercises, data on load distribution and many more.
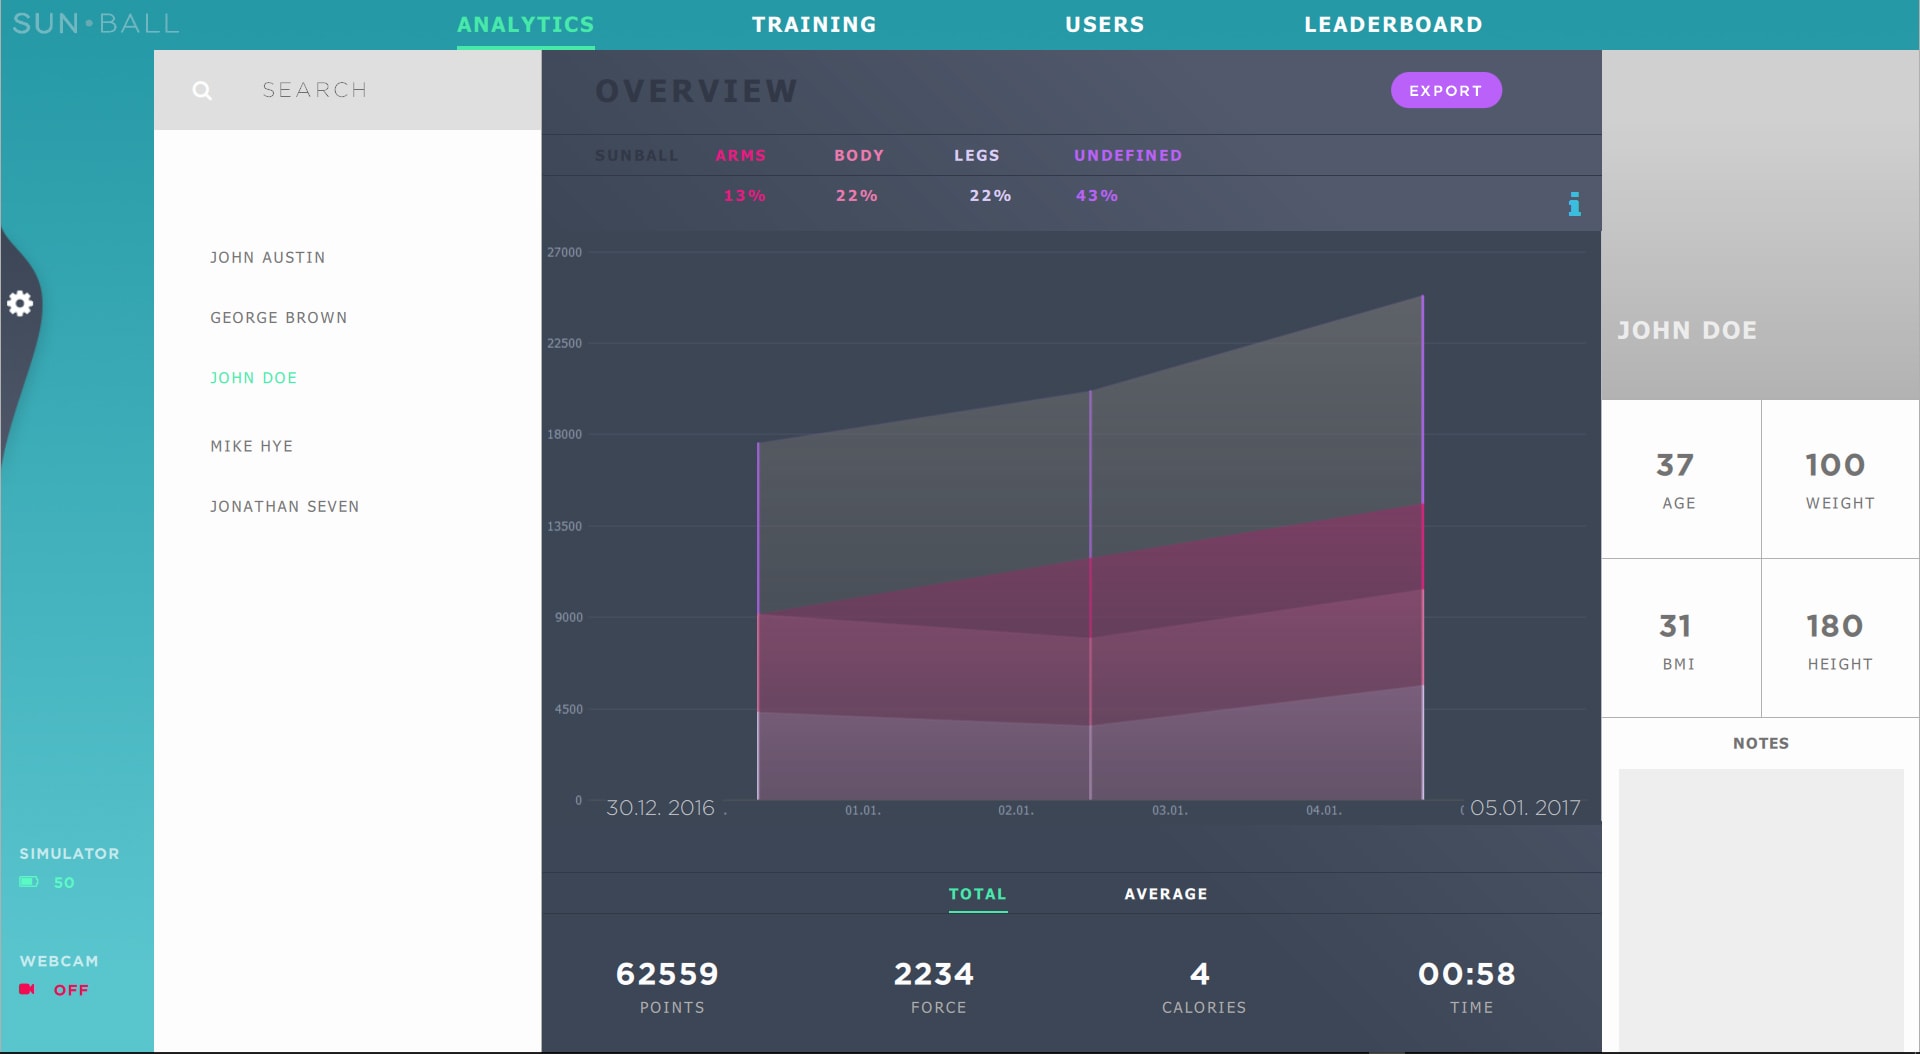
In the left column “Users” choose the user, whose data you want to check. Move and zoom option of the graph allows you to show data in an chosen interval.
Graphical representation of data makes easier to infer a conclusion about patient's long-term progress, composition of her recovery and load distribution onto different parts of body.
- legs
- arms
- body
- undefined
SunApp collects data during training and other information about therapy, pressure, etc.
- Points – you collect points by playing games and you can check your progress
- Strength – an aproximation of your strength used when squeezing the balloons during the exercise
- Time – length of exercise
- Calories – number of calories burned during exercise
- Webcam - in the case of manual switching on the webcam pictures are saved right after exercise change
Export Data
All the data from the analytical part can be printed, or exported as a screenshot. To do this, click “Export” in the top bar.
Upcoming software release should be able to export data as pdf or xls file. See also upcoming improvements.
Detailed View
You can check also detailed record of your exercises in the Analytical part. To show them, simply double click on the graph bar of the chosen day. Detailed chart will popup with visualization of each press of the ball during the exercise along with other data.
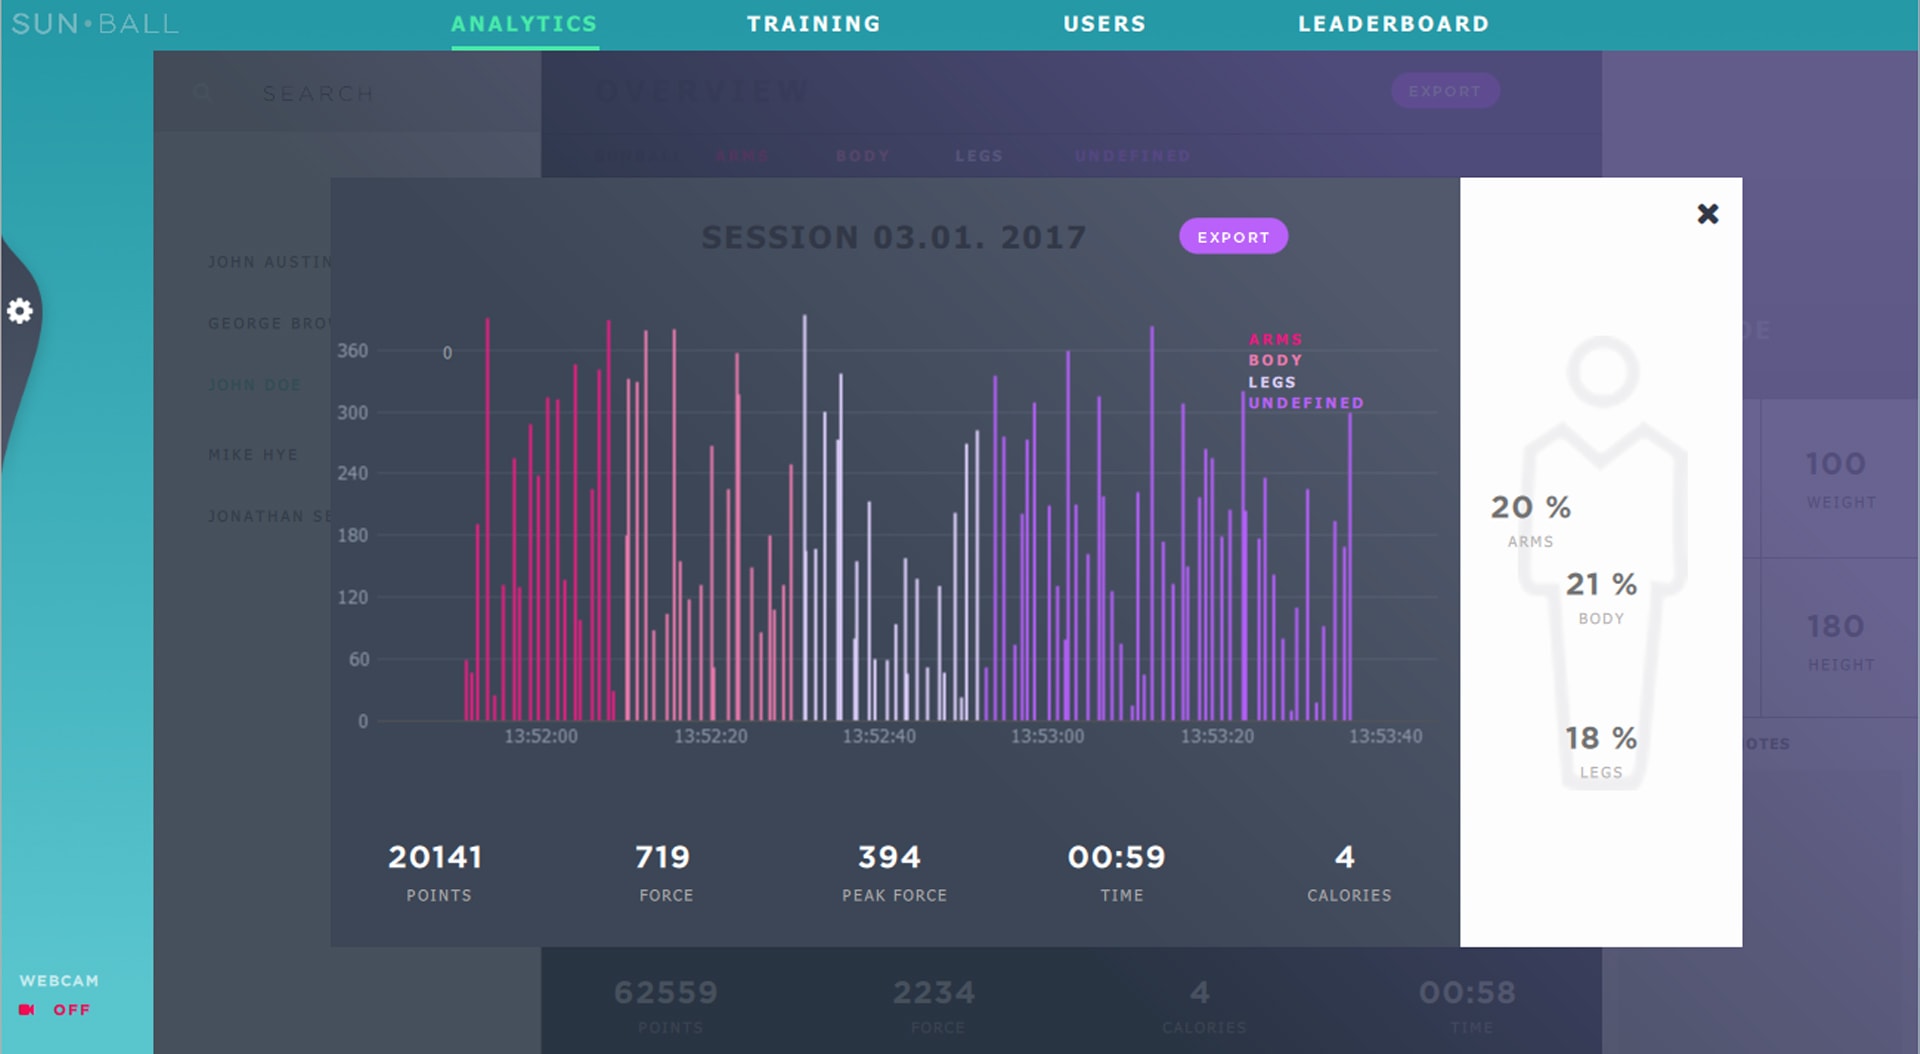
You can analyze in detail the progress of the recovery, magnitude of the applied pressure, in which game it was achieved, display a photo from webcam, to zoom in or change the display range (with the mouse) and see data about the patient load distribution during the day.